12
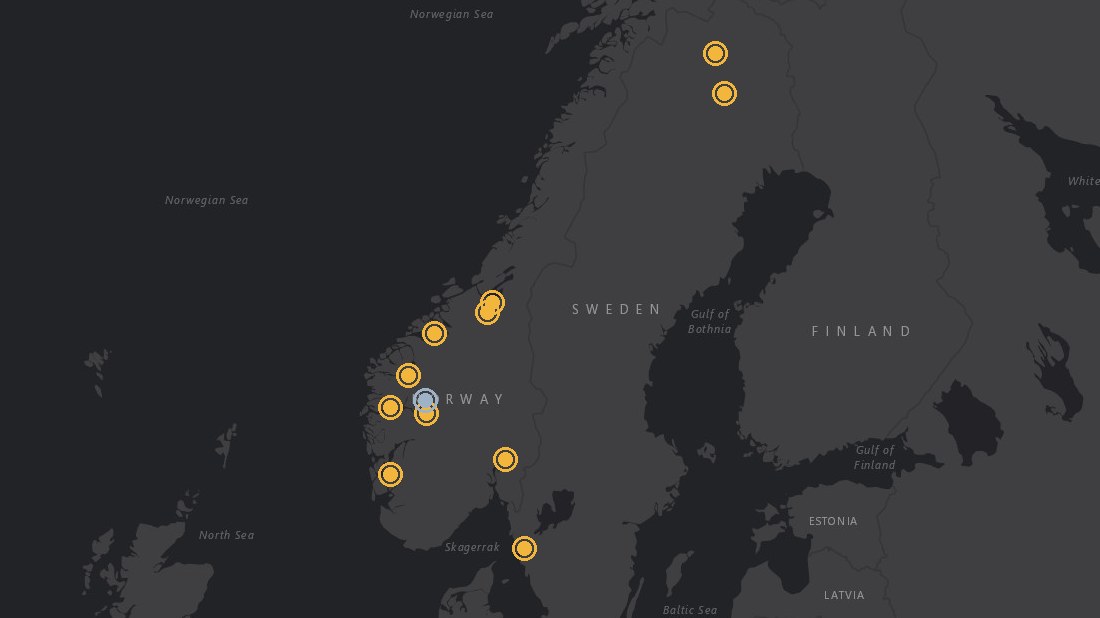
sites on the map: ten landslide and quiet-control sites in Norway and Sweden, plus Kiruna and Malmberget


Foundation models
Detecting a landslide after it happens is not the hard part. We are testing whether a foundation model, trained on radar ground motion together with the weather, soil and land cover that drive it, can say where and when the ground is likely to start moving.
Work in progress. The processing chain is built and the maps below are real results. The forecasting test is still running, so this story reports what works and what does not yet.
Click a dot to fly there. A site loads up to about 20 MB of point data.
12
sites on the map: ten landslide and quiet-control sites in Norway and Sweden, plus Kiruna and Malmberget
2
Sentinel-1 radar tracks per site, one ascending and one descending, combined into vertical and east motion
7 and 30 days
forecast horizons for landslides; 3, 6 and 12 months for subsidence
Predicting a landslide needs more than the motion itself. It needs the water cycle, erosion, freeze and thaw, land cover and the soil material, and how they combine in different conditions. We pretrain one model on these signals without labels, then check whether it forecasts better, transfers to regions with few recorded events, and adapts with fewer parameters than the classical statistical and physical models.
Radar ground motion is the central signal. It shows where to look, and how it changes over time shows whether the ground is speeding up.
The first test uses recorded Norwegian landslides from the NVE inventory, a Swedish quick-clay case, a quiet control site with no recorded event, and the mining towns of Kiruna and Malmberget. Every dot on a site map is a 10 m cell seen by both radar tracks. Click it to see its vertical, east and line-of-sight time series.
These maps are training data for the model, not a monitoring service for any asset. Each one covers a window around a known incident, from about two years before to two months after, so the model can learn what ground motion looks like before a landslide. They do not run up to today.
Audit the NVE and SGI landslide inventories for events with a date and a place good enough to test a forecast.
Pick incidents, draw a box around each, and find the Sentinel-1 tracks that cover it.
Download the images and process one stack per track on GPU nodes. Winter images are dropped because snow breaks the radar phase.
Daily rain, temperature, snow and melt from seNorge, and atmospheric delay from ERA5.
Mask unreliable pixels, remove height-related phase, choose a stable reference, and cut cubes for the model.
For a forecast on a given date the radar is reprocessed with images up to that date, so later images cannot leak into earlier values.
Fix which events are for training, validation and testing before any model sees them, with withheld regions and later years.
Train the foundation model and compare it with a persistence baseline and a weather-only classifier.
Processed from Copernicus Sentinel-1 data. Weather from seNorge and ERA5. Landslide records from NVE and SGI. Base map tiles © Esri.